Education Design - Components
Motion Graphis
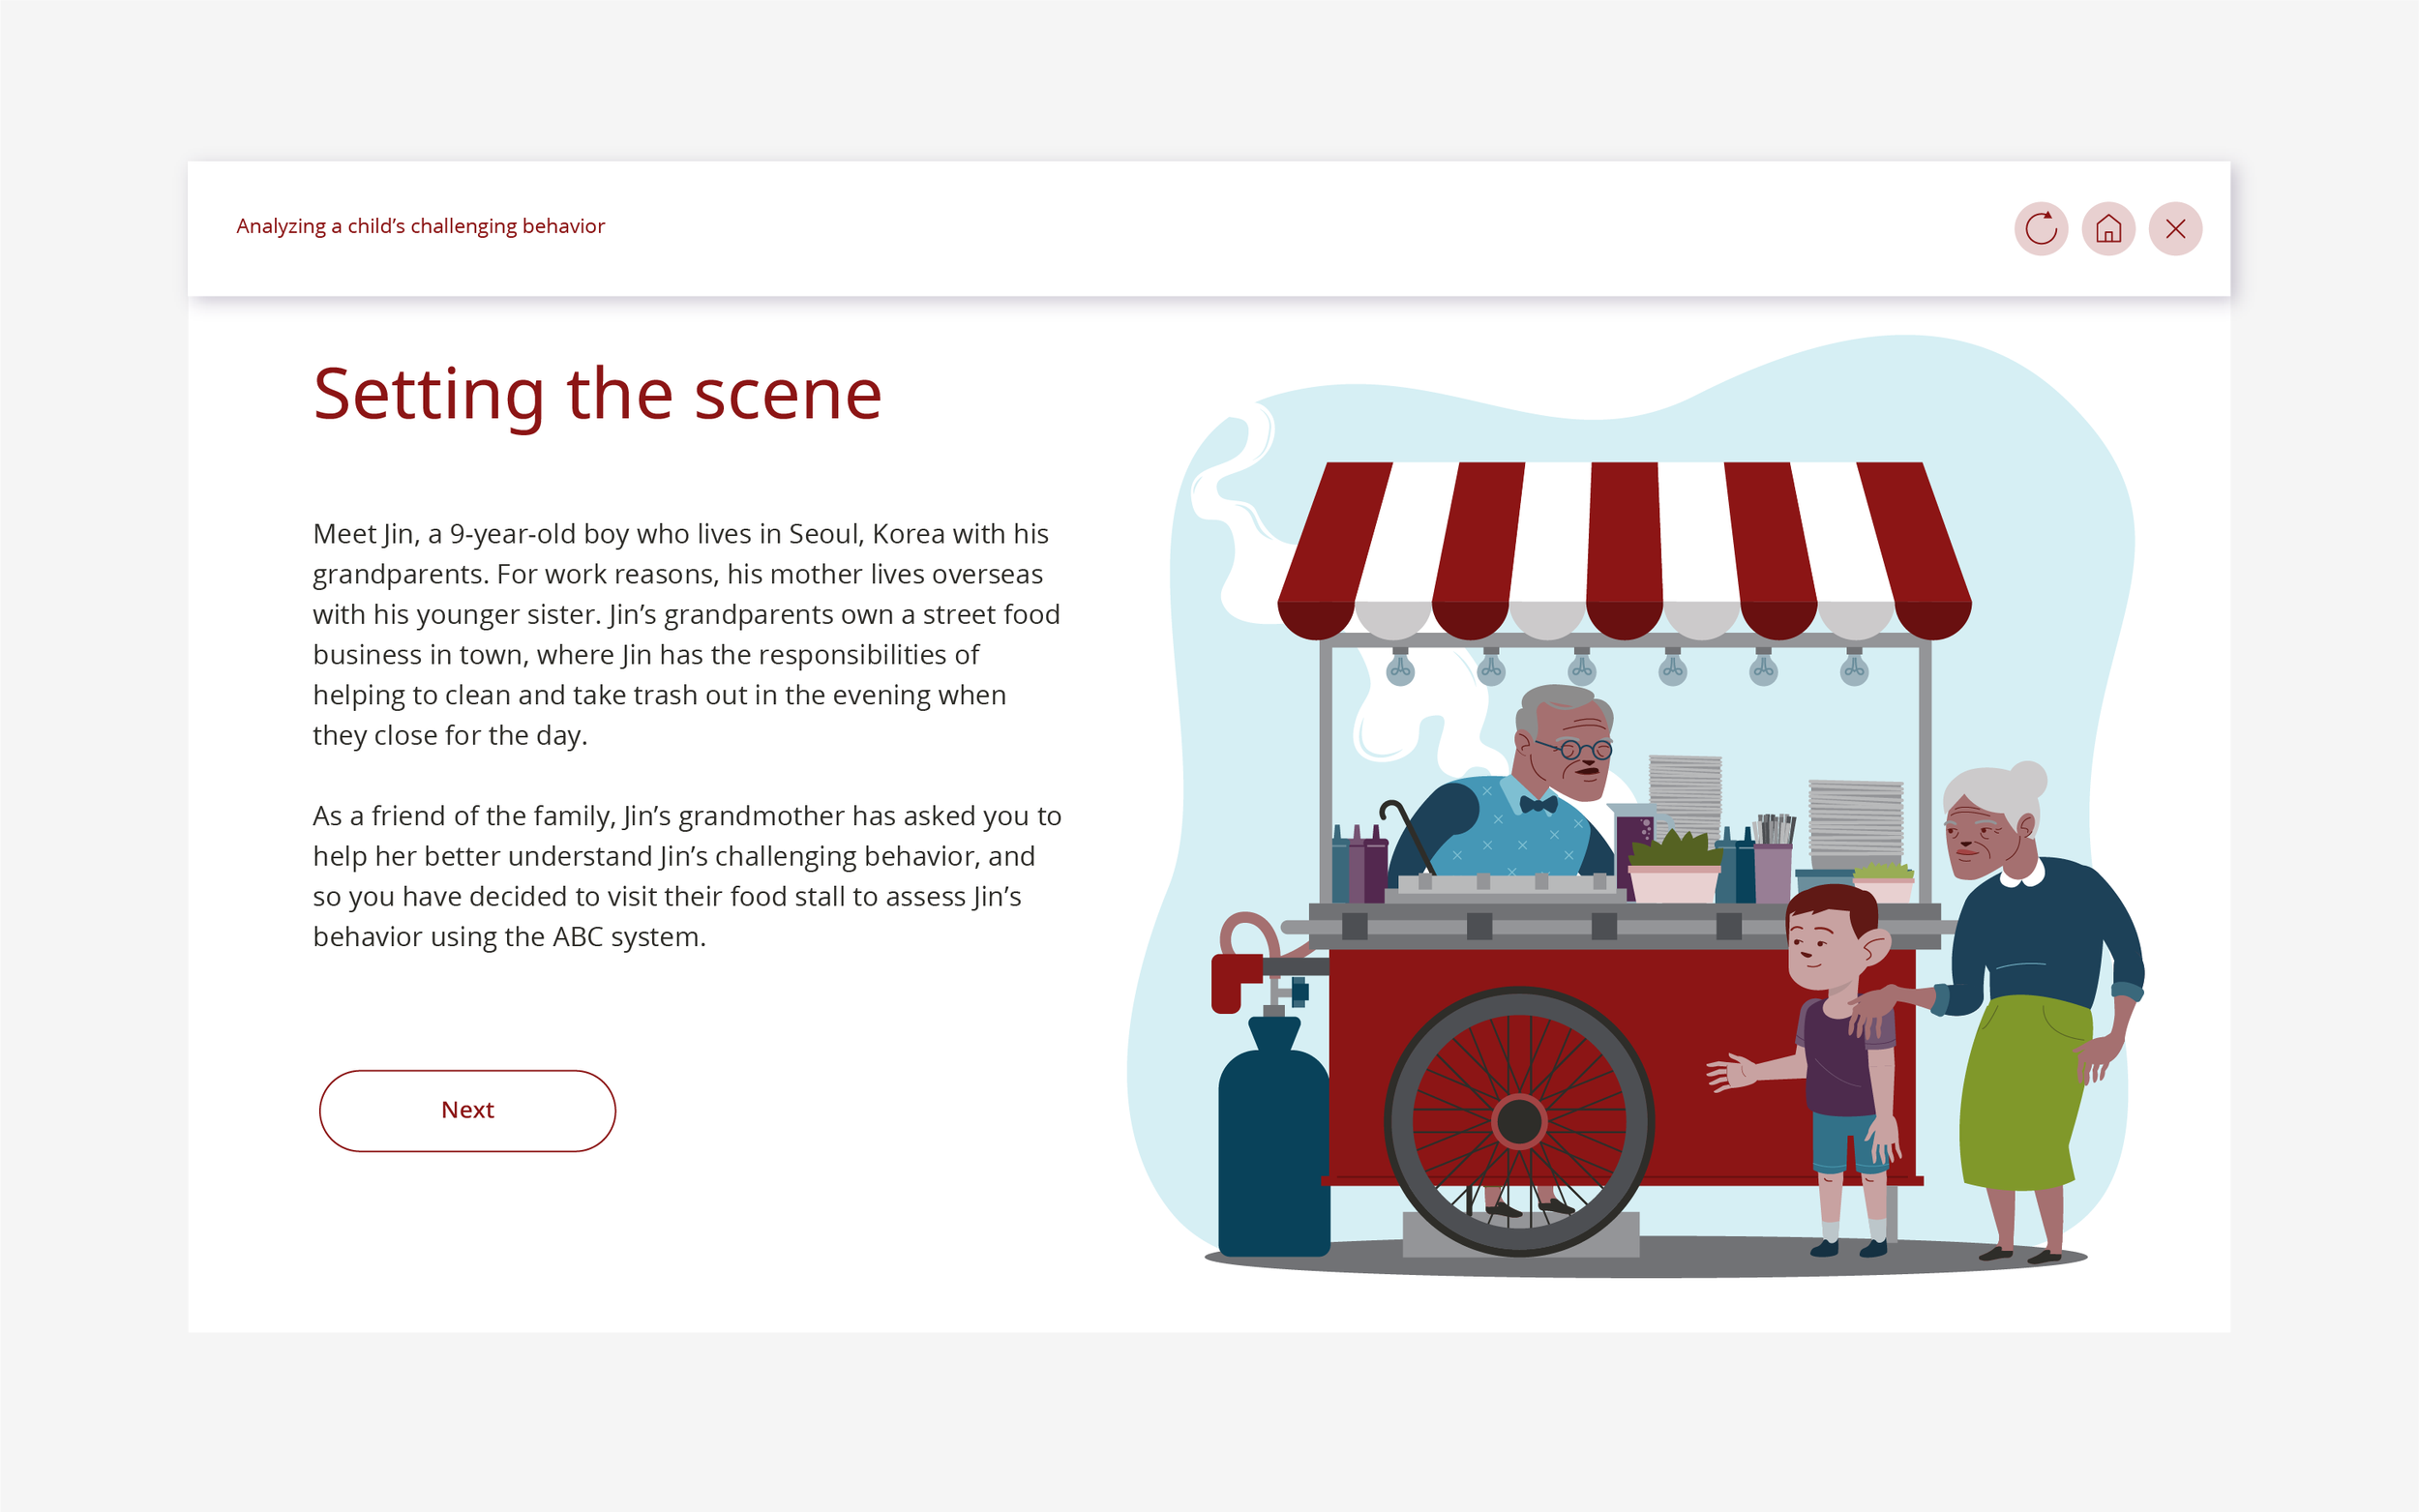
Motion illustration is the art of bringing static visuals to life through movement, often used to enhance storytelling in digital content. The process begins with a collaborative brainstorming session, where we define the purpose, tone, and key messages of the piece. From there, a detailed storyboard is created to map out the visual narrative and specify motion requirements, such as transitions, pacing, and interaction cues. This stage ensures clarity before any artwork is developed.
Illustrations are then carefully designed with animation in mind, ensuring each element is layered and structured for motion. This layered approach allows for dynamic movement, smooth transitions, and flexibility during the animation phase. The result is a compelling, visually rich story that engages audiences through fluid, purposeful motion.


2. Notes Graphics
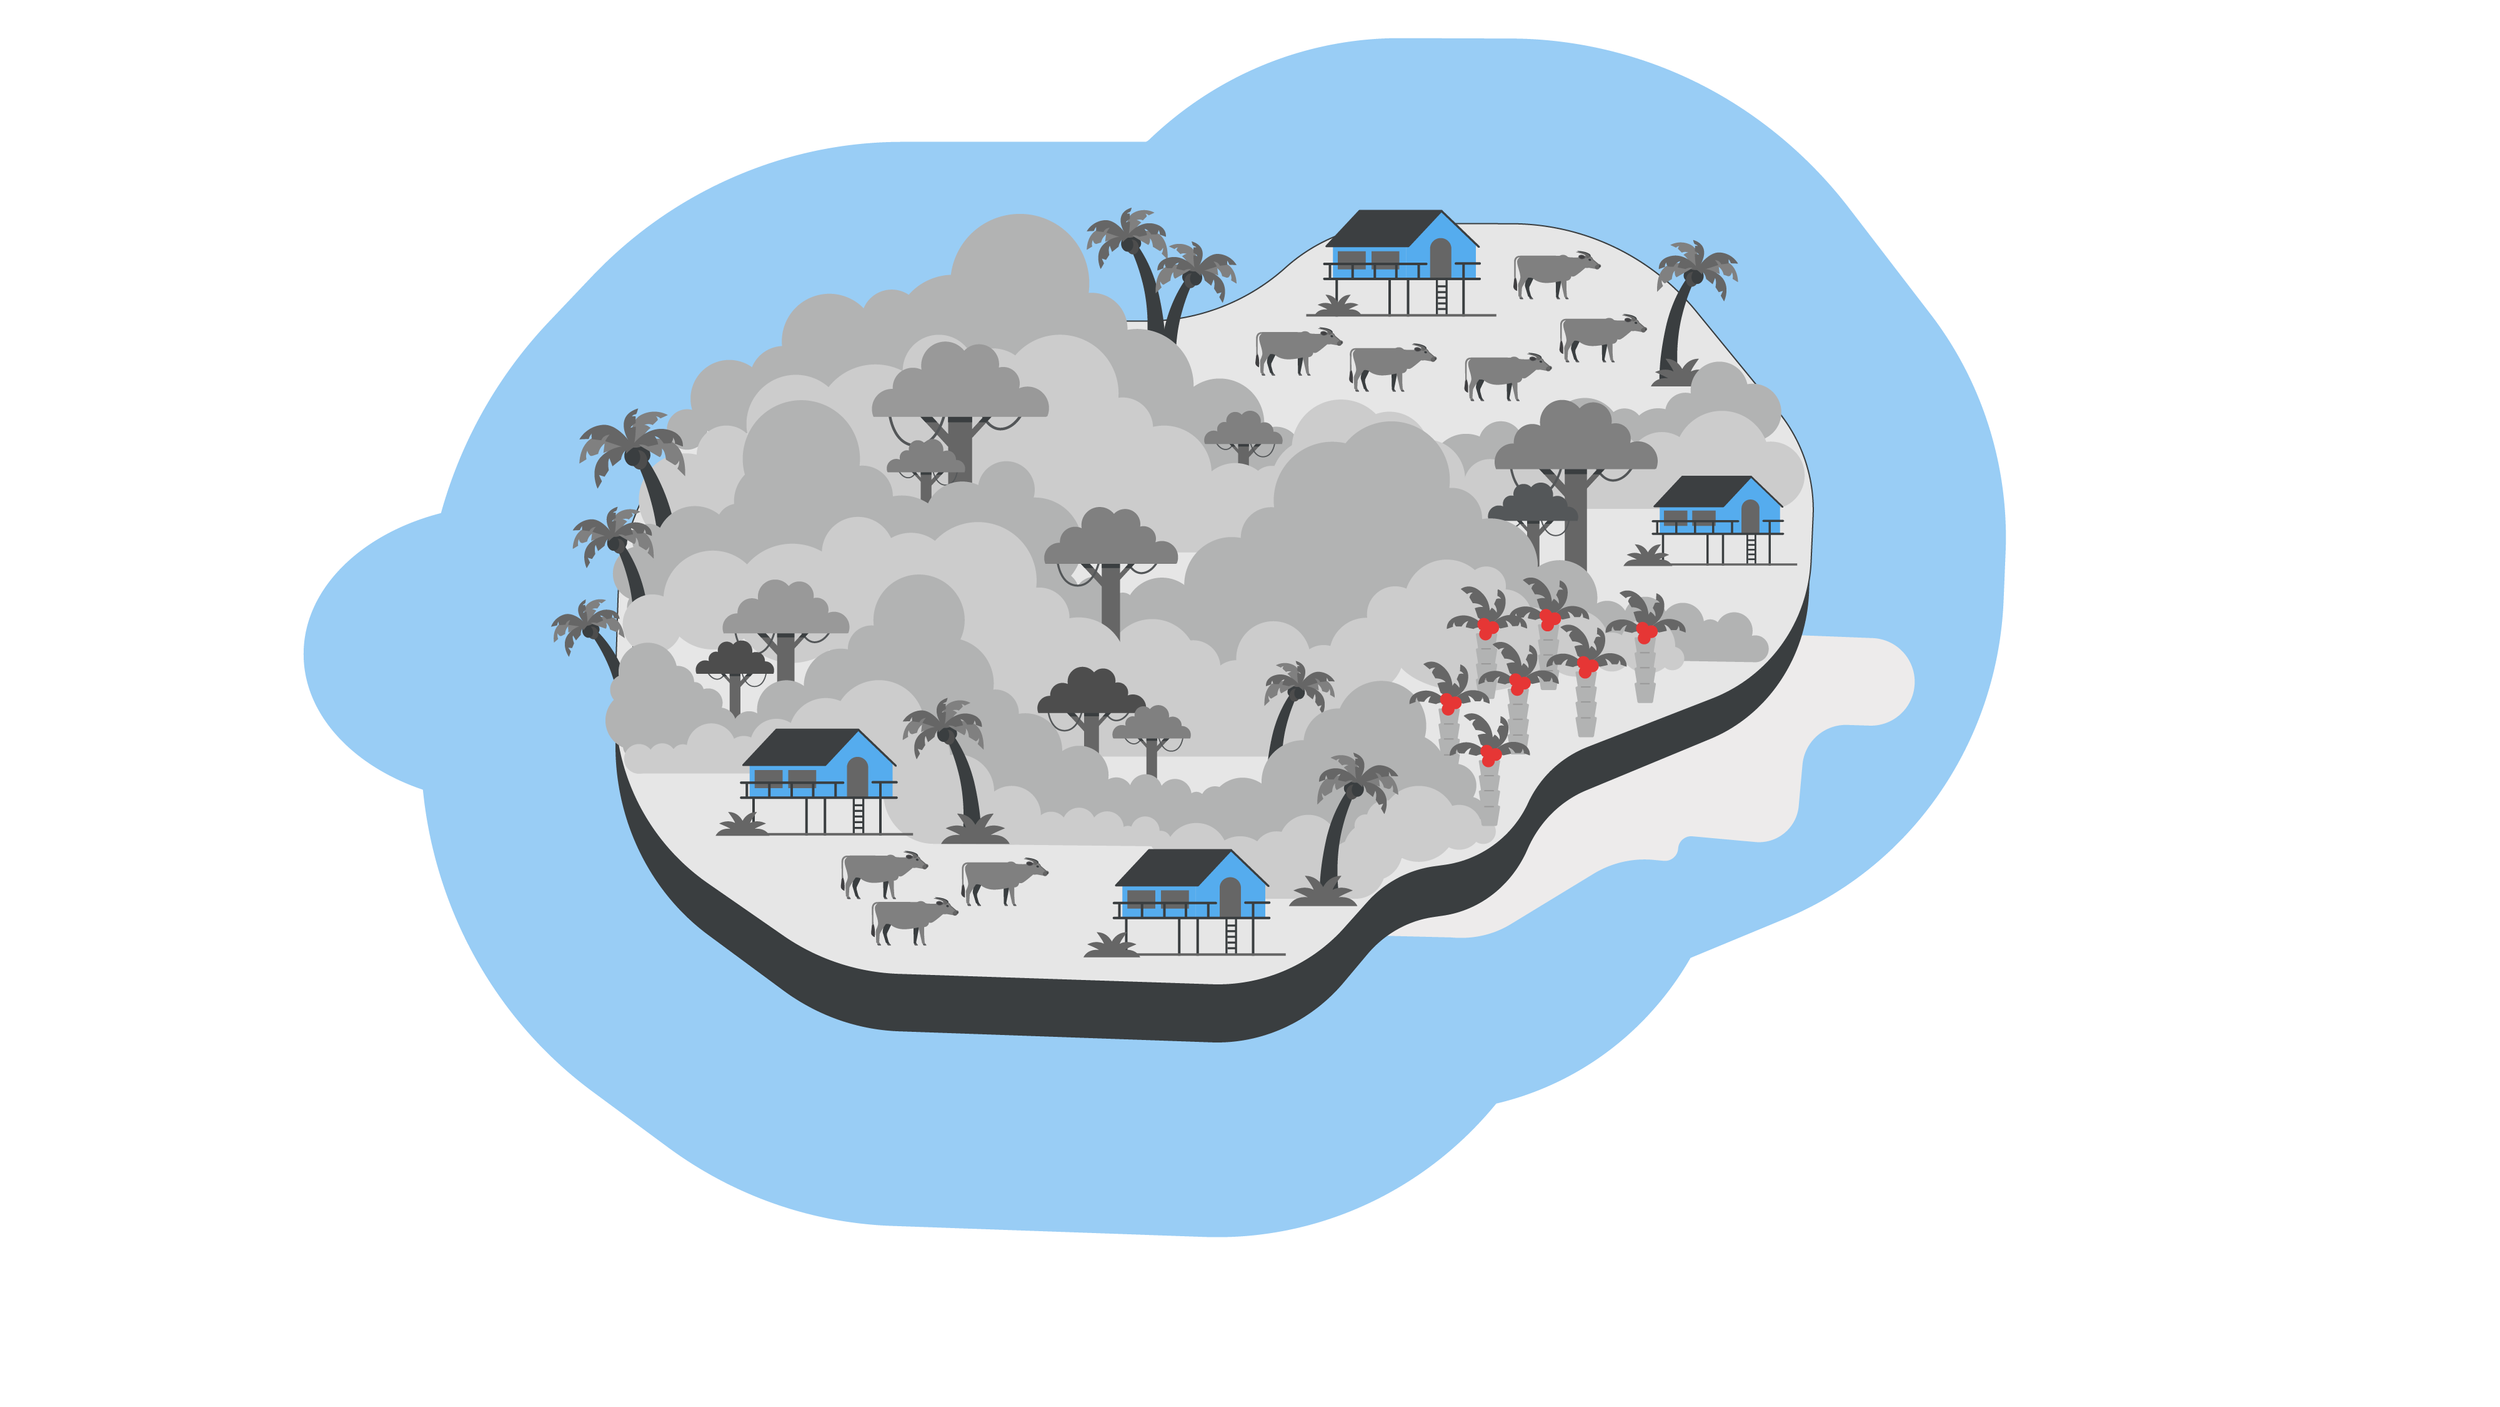
Notes graphics are carefully crafted visual elements designed to complement and clarify complex text, graphs, or data. They serve as visual aids that enhance understanding, making information more accessible and engaging for the viewer.
The process starts with a collaborative session to unpack the key ideas, data points, or narratives that need visual support. From this, we determine the best graphic approach — whether it's an illustrated diagram, an annotated chart, or a conceptual visual.
Each illustration is purposefully designed to highlight relationships, simplify dense content, or reinforce key messages. The result is a set of intuitive, layered visuals that elevate communication and support clearer comprehension across digital or print formats.
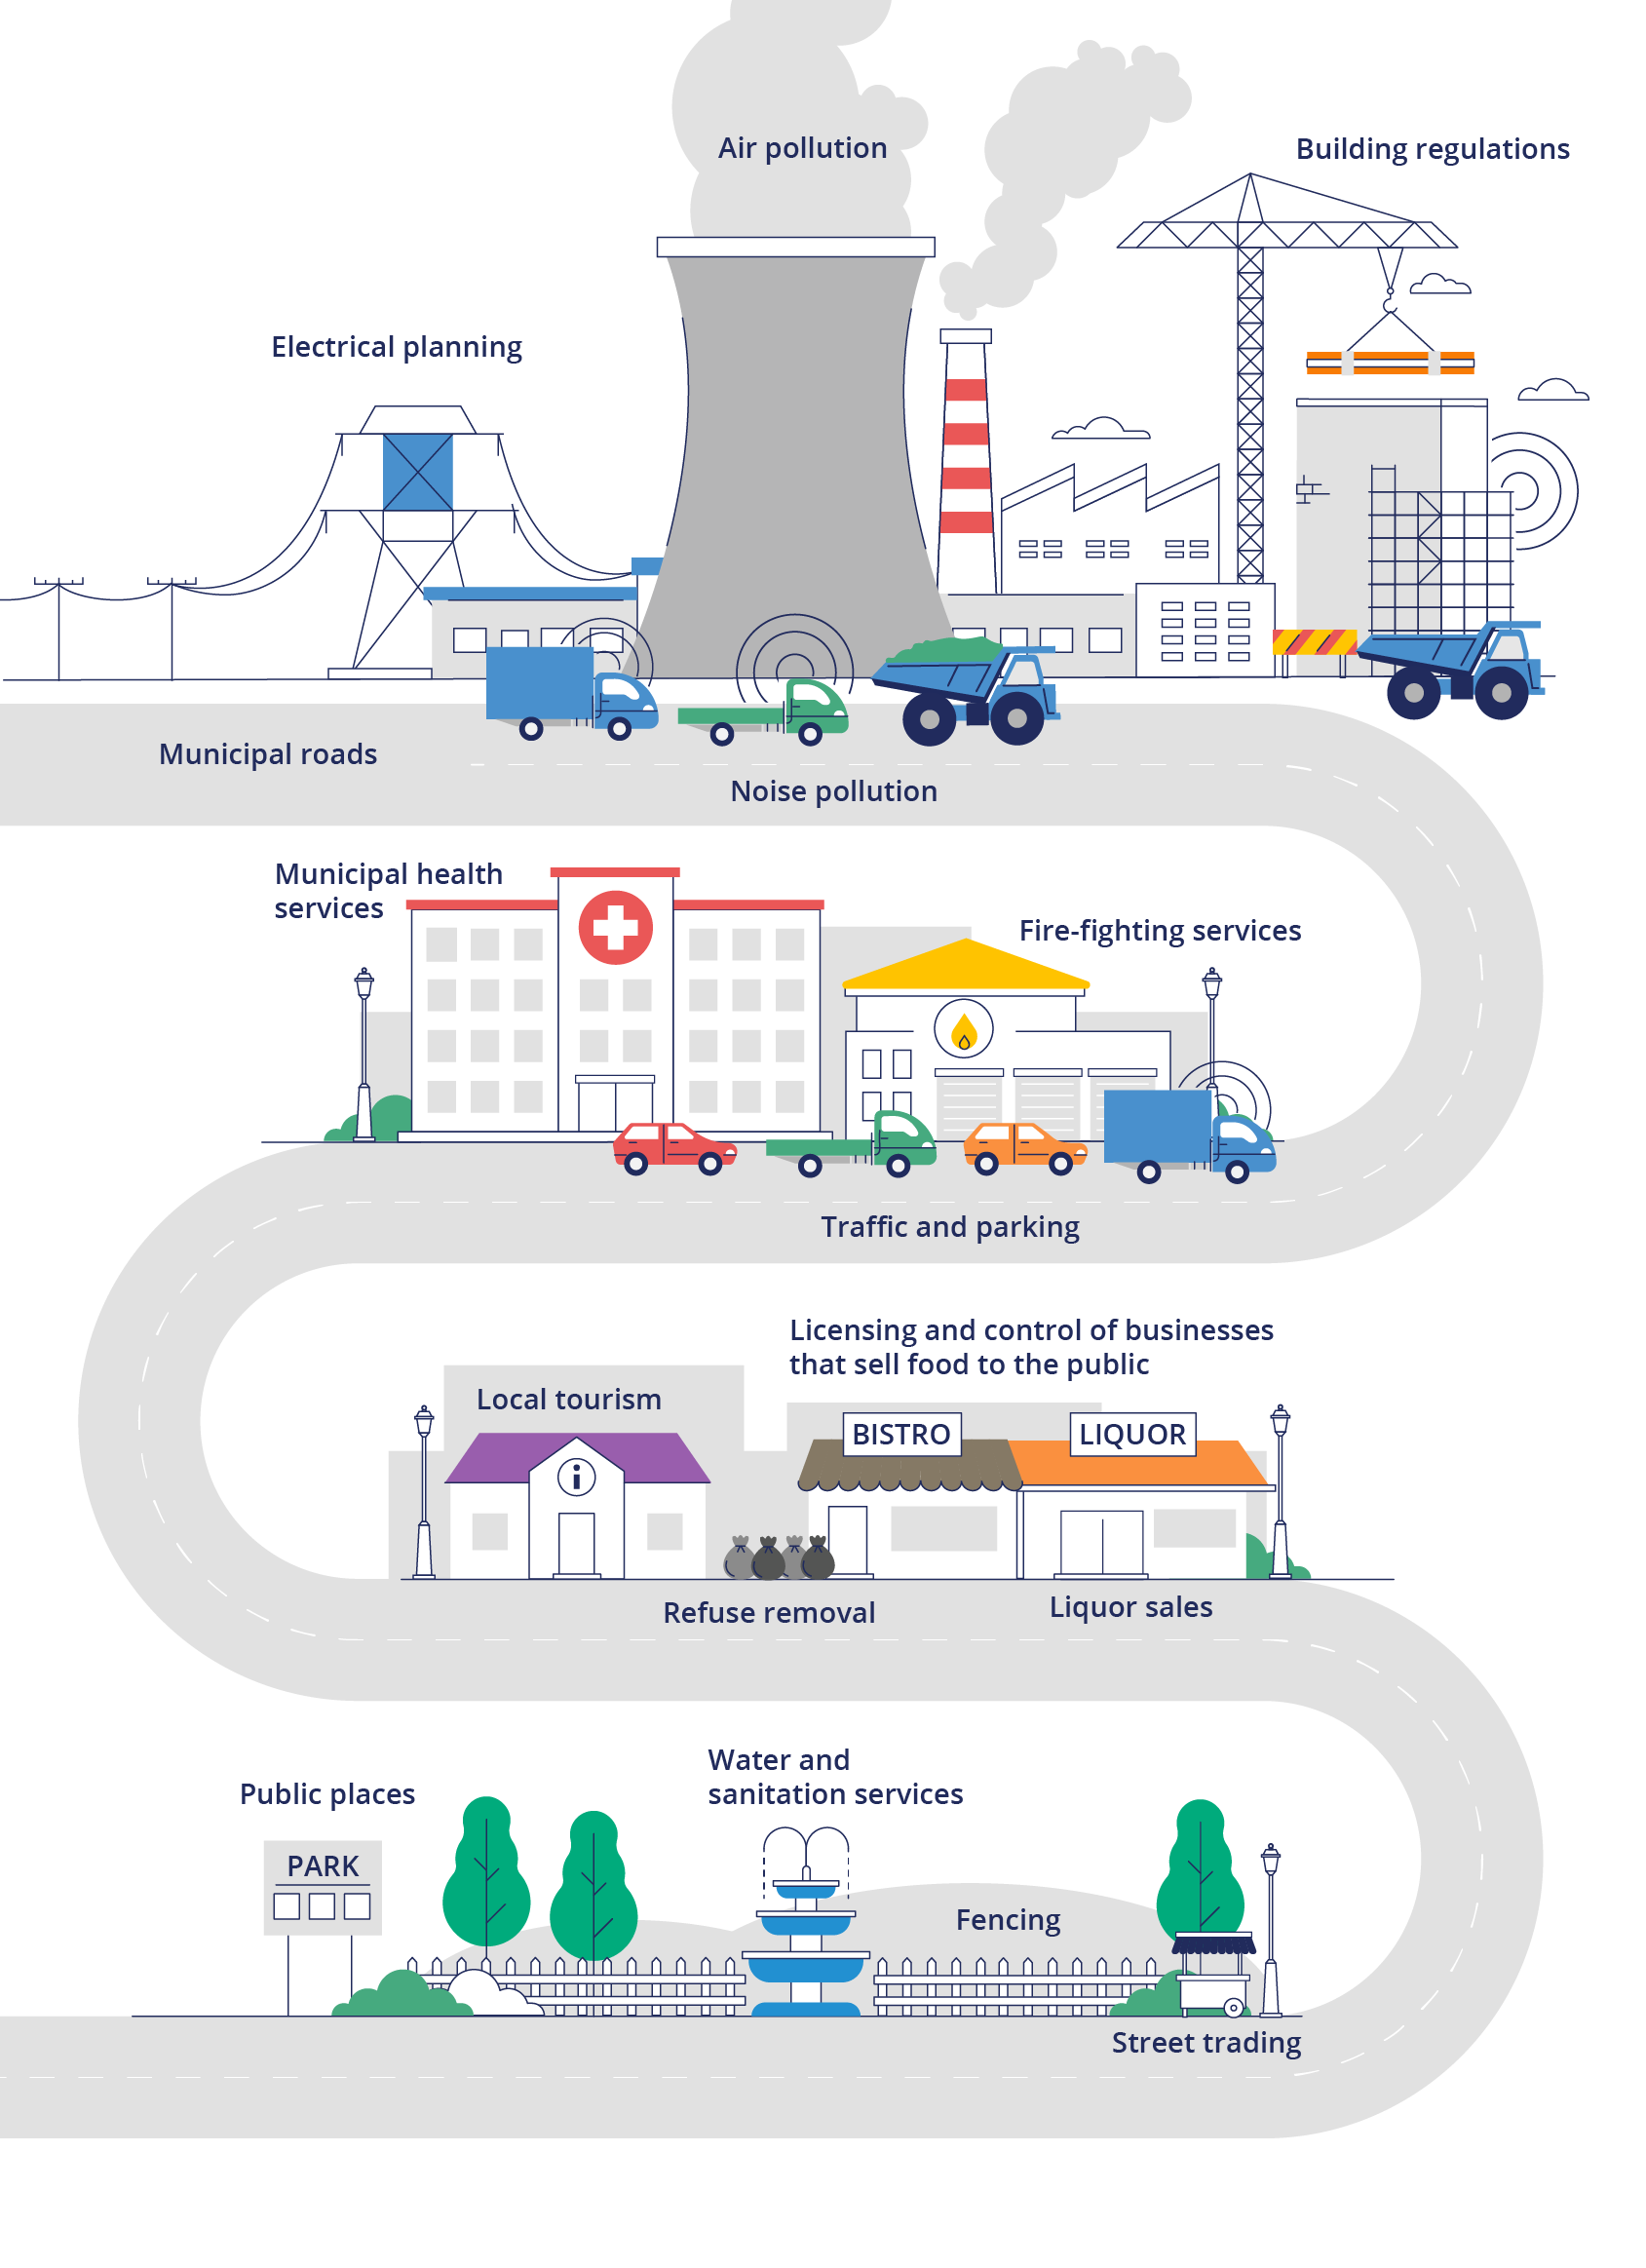


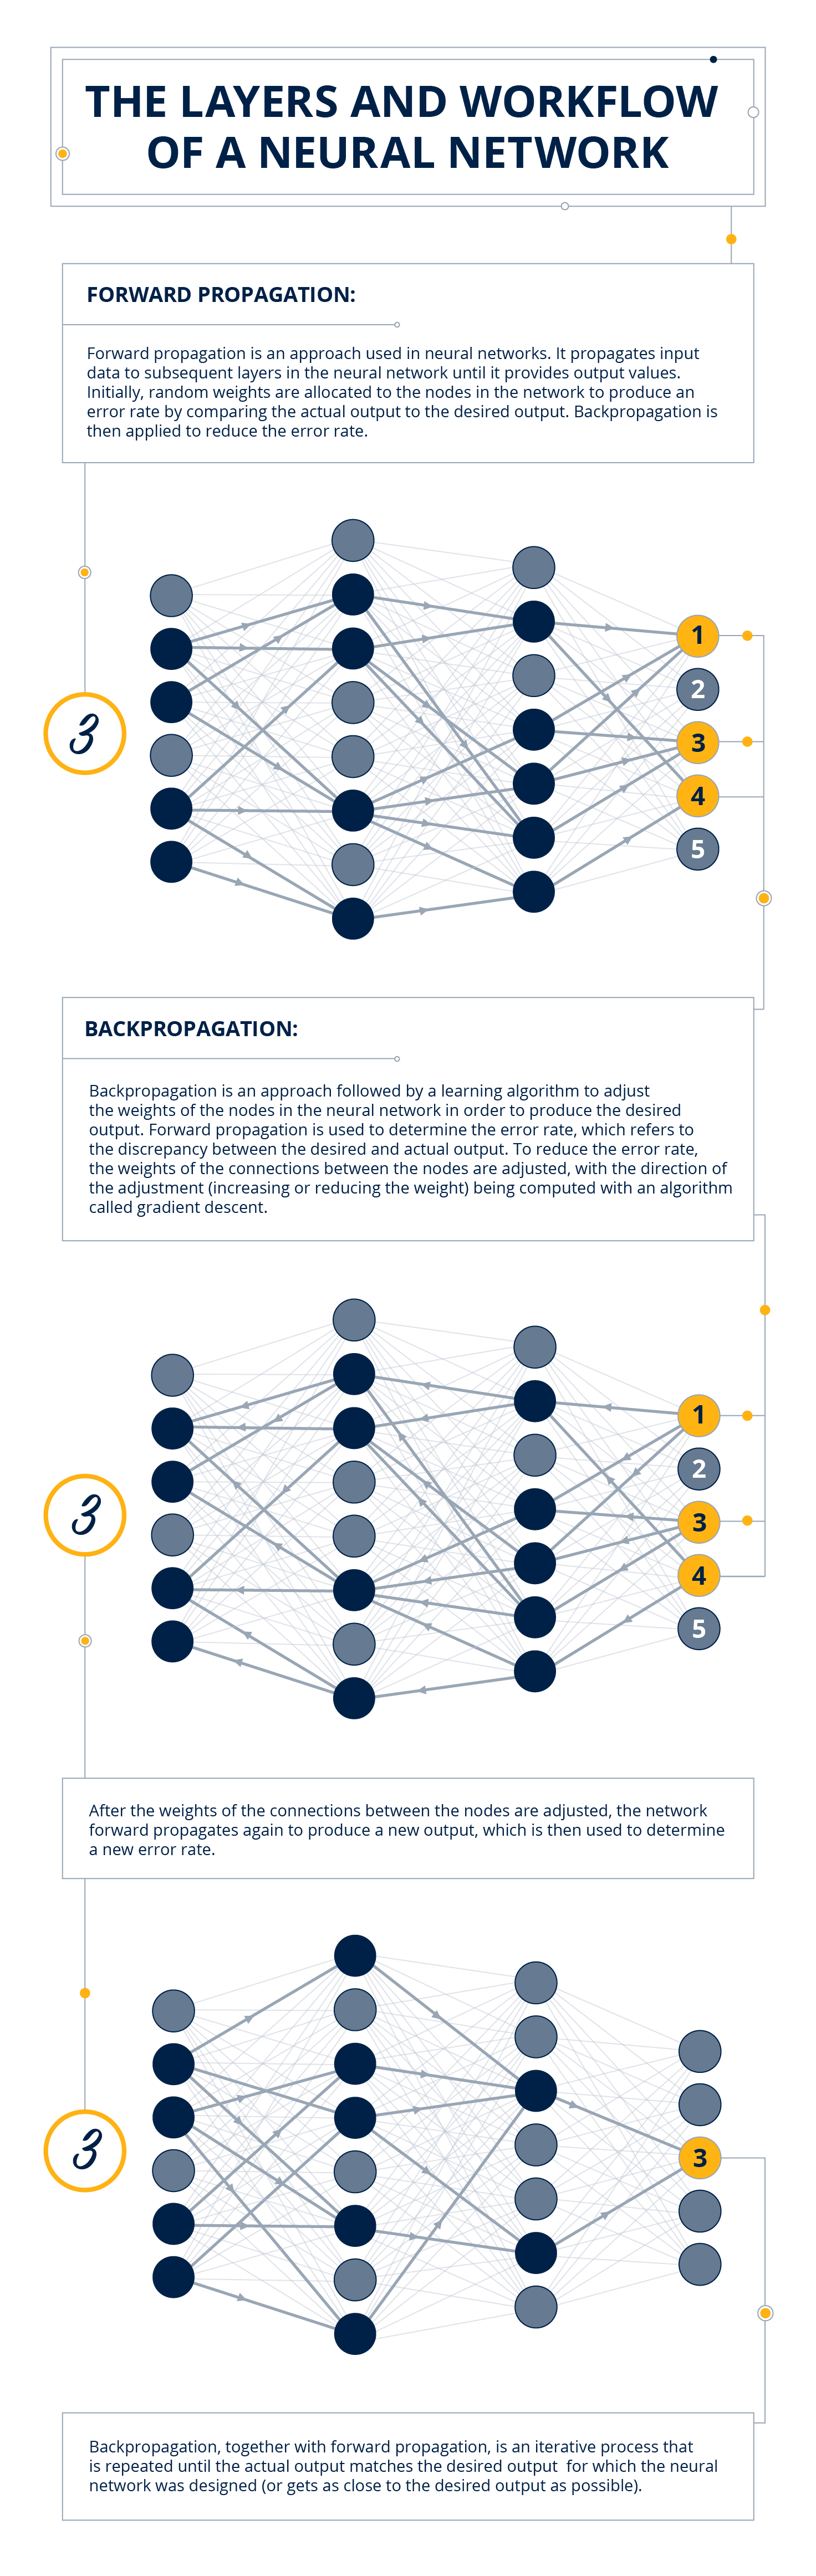
3. Infographics
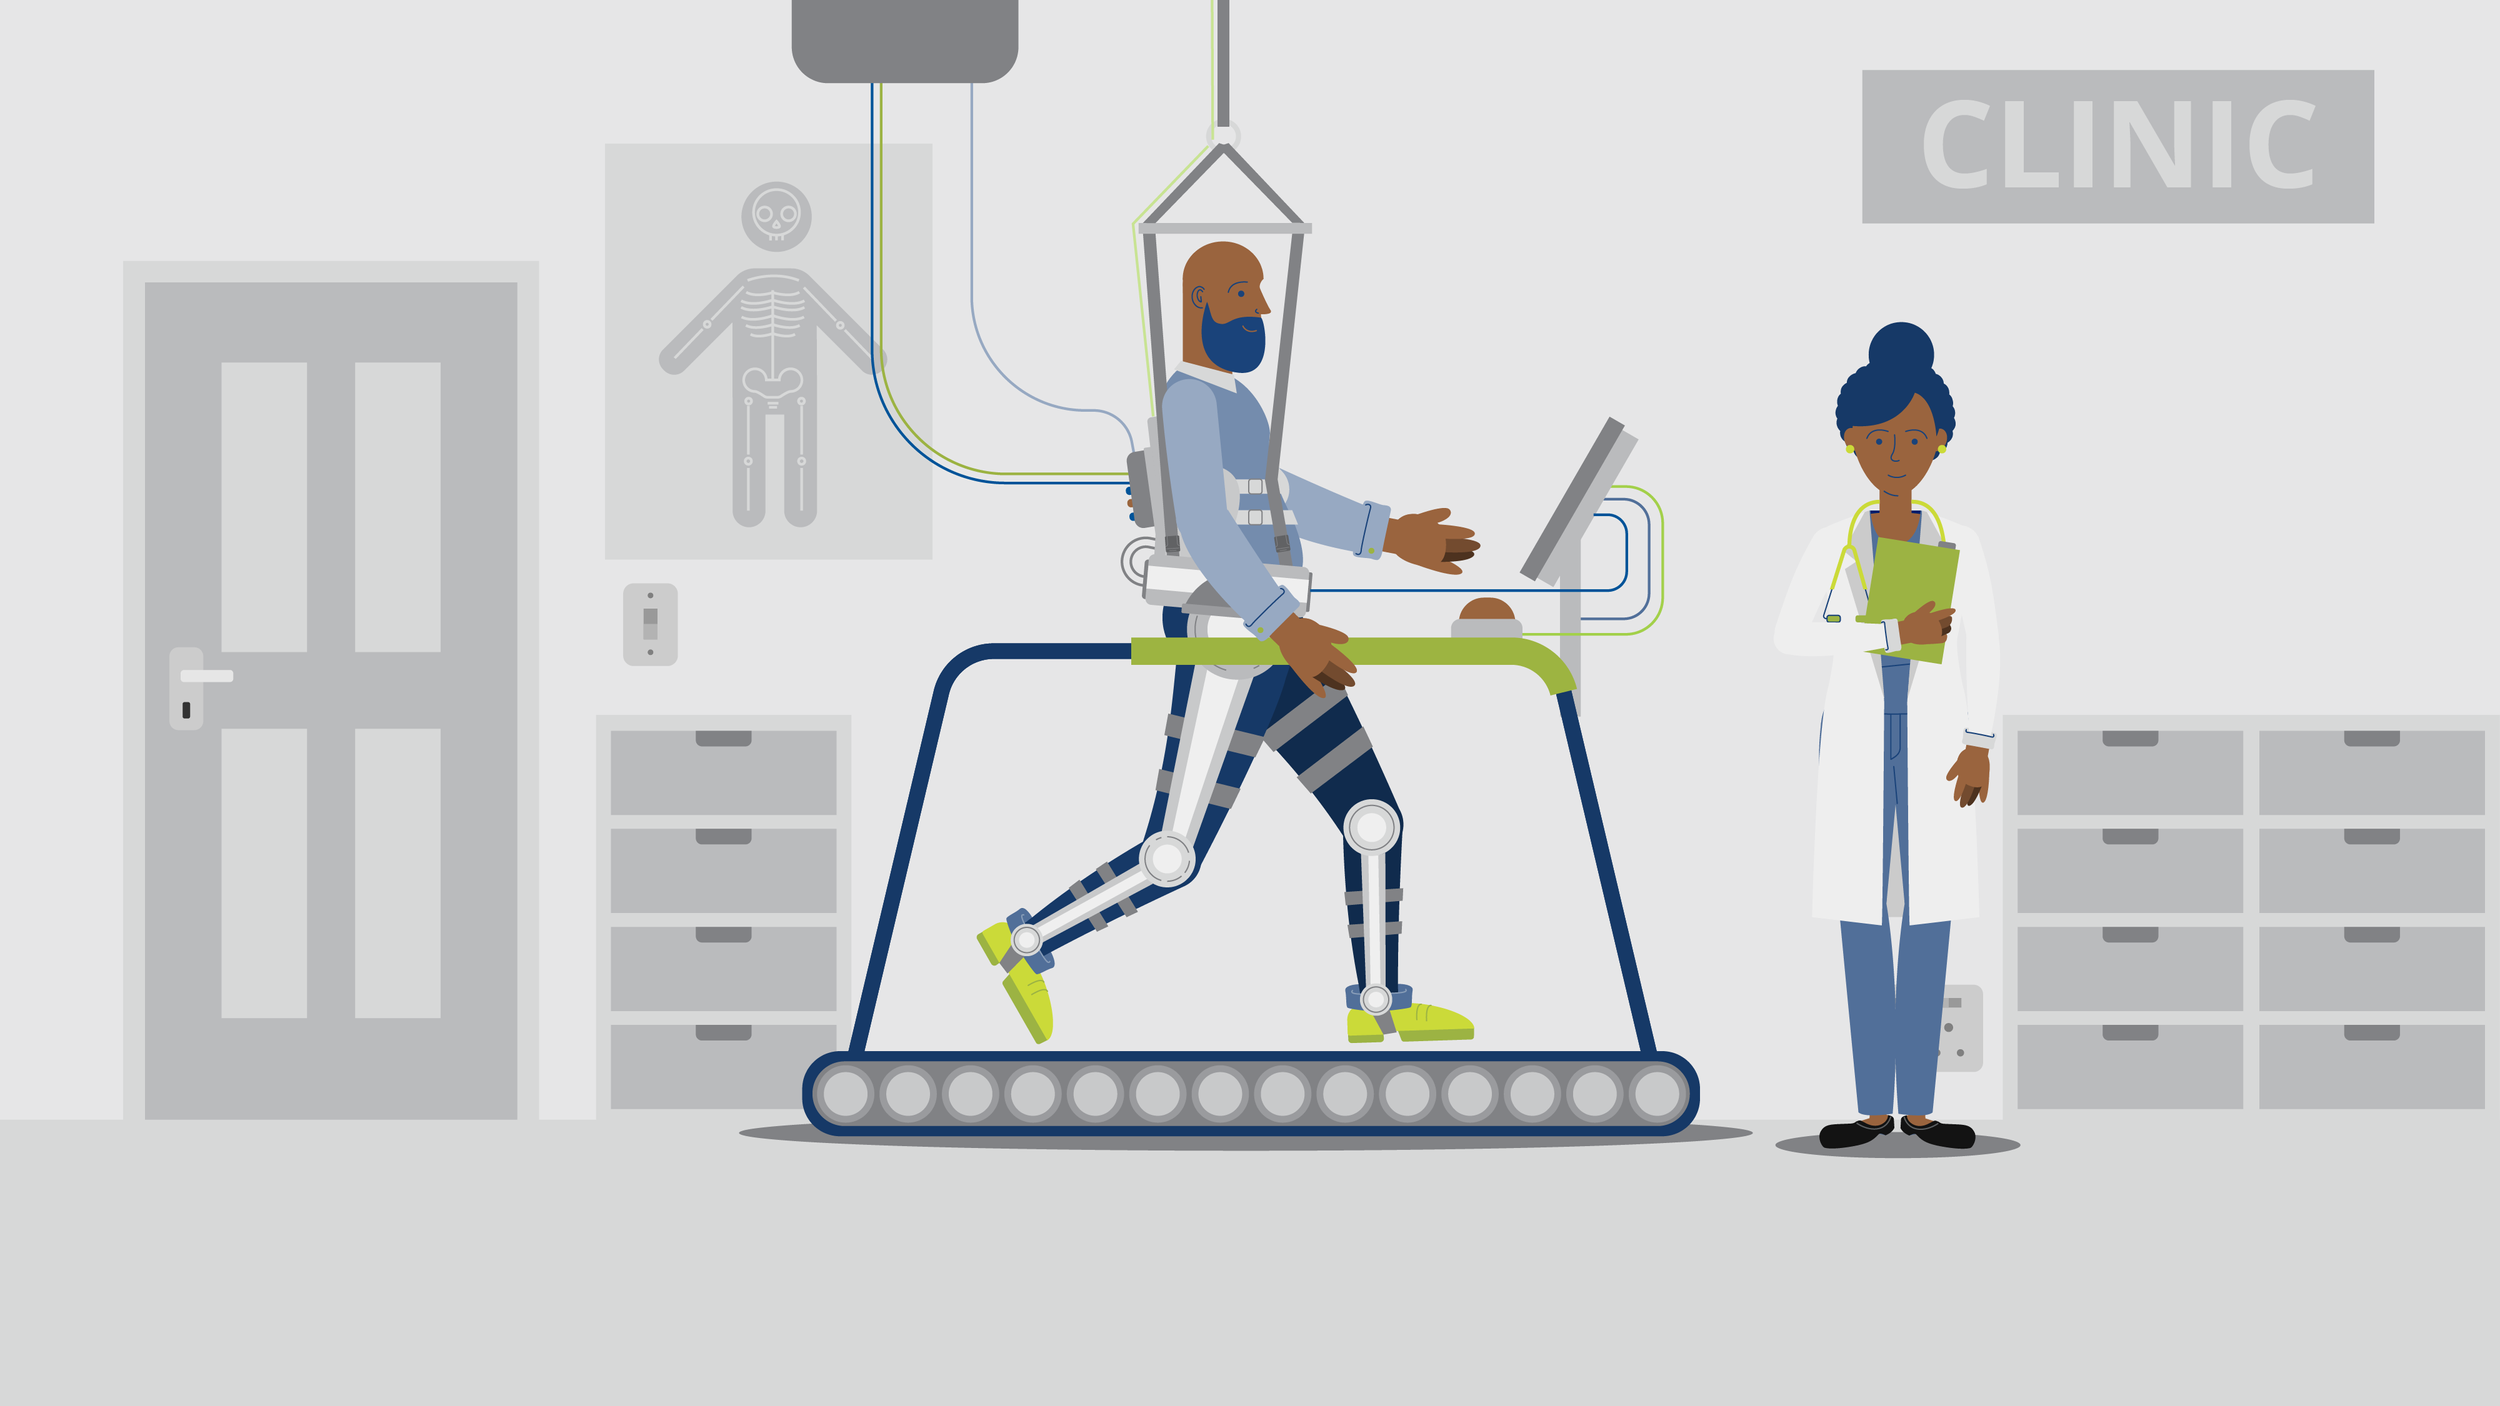
Infographics are structured visual representations that transform complex information into clear, engaging, and easily digestible content. They combine data, illustration, and typography to tell a story at a glance, helping viewers quickly grasp key insights.
The process begins with defining the objective and identifying the core message or dataset to be visualised. From there, we map out a visual hierarchy and narrative flow, often through sketches or wireframes. This ensures the layout supports clarity, logic, and visual appeal.
Design and illustration follow, with every element intentionally crafted to highlight patterns, comparisons, or trends. The final infographic is not just visually appealing — it’s a powerful communication tool that turns information into impact.


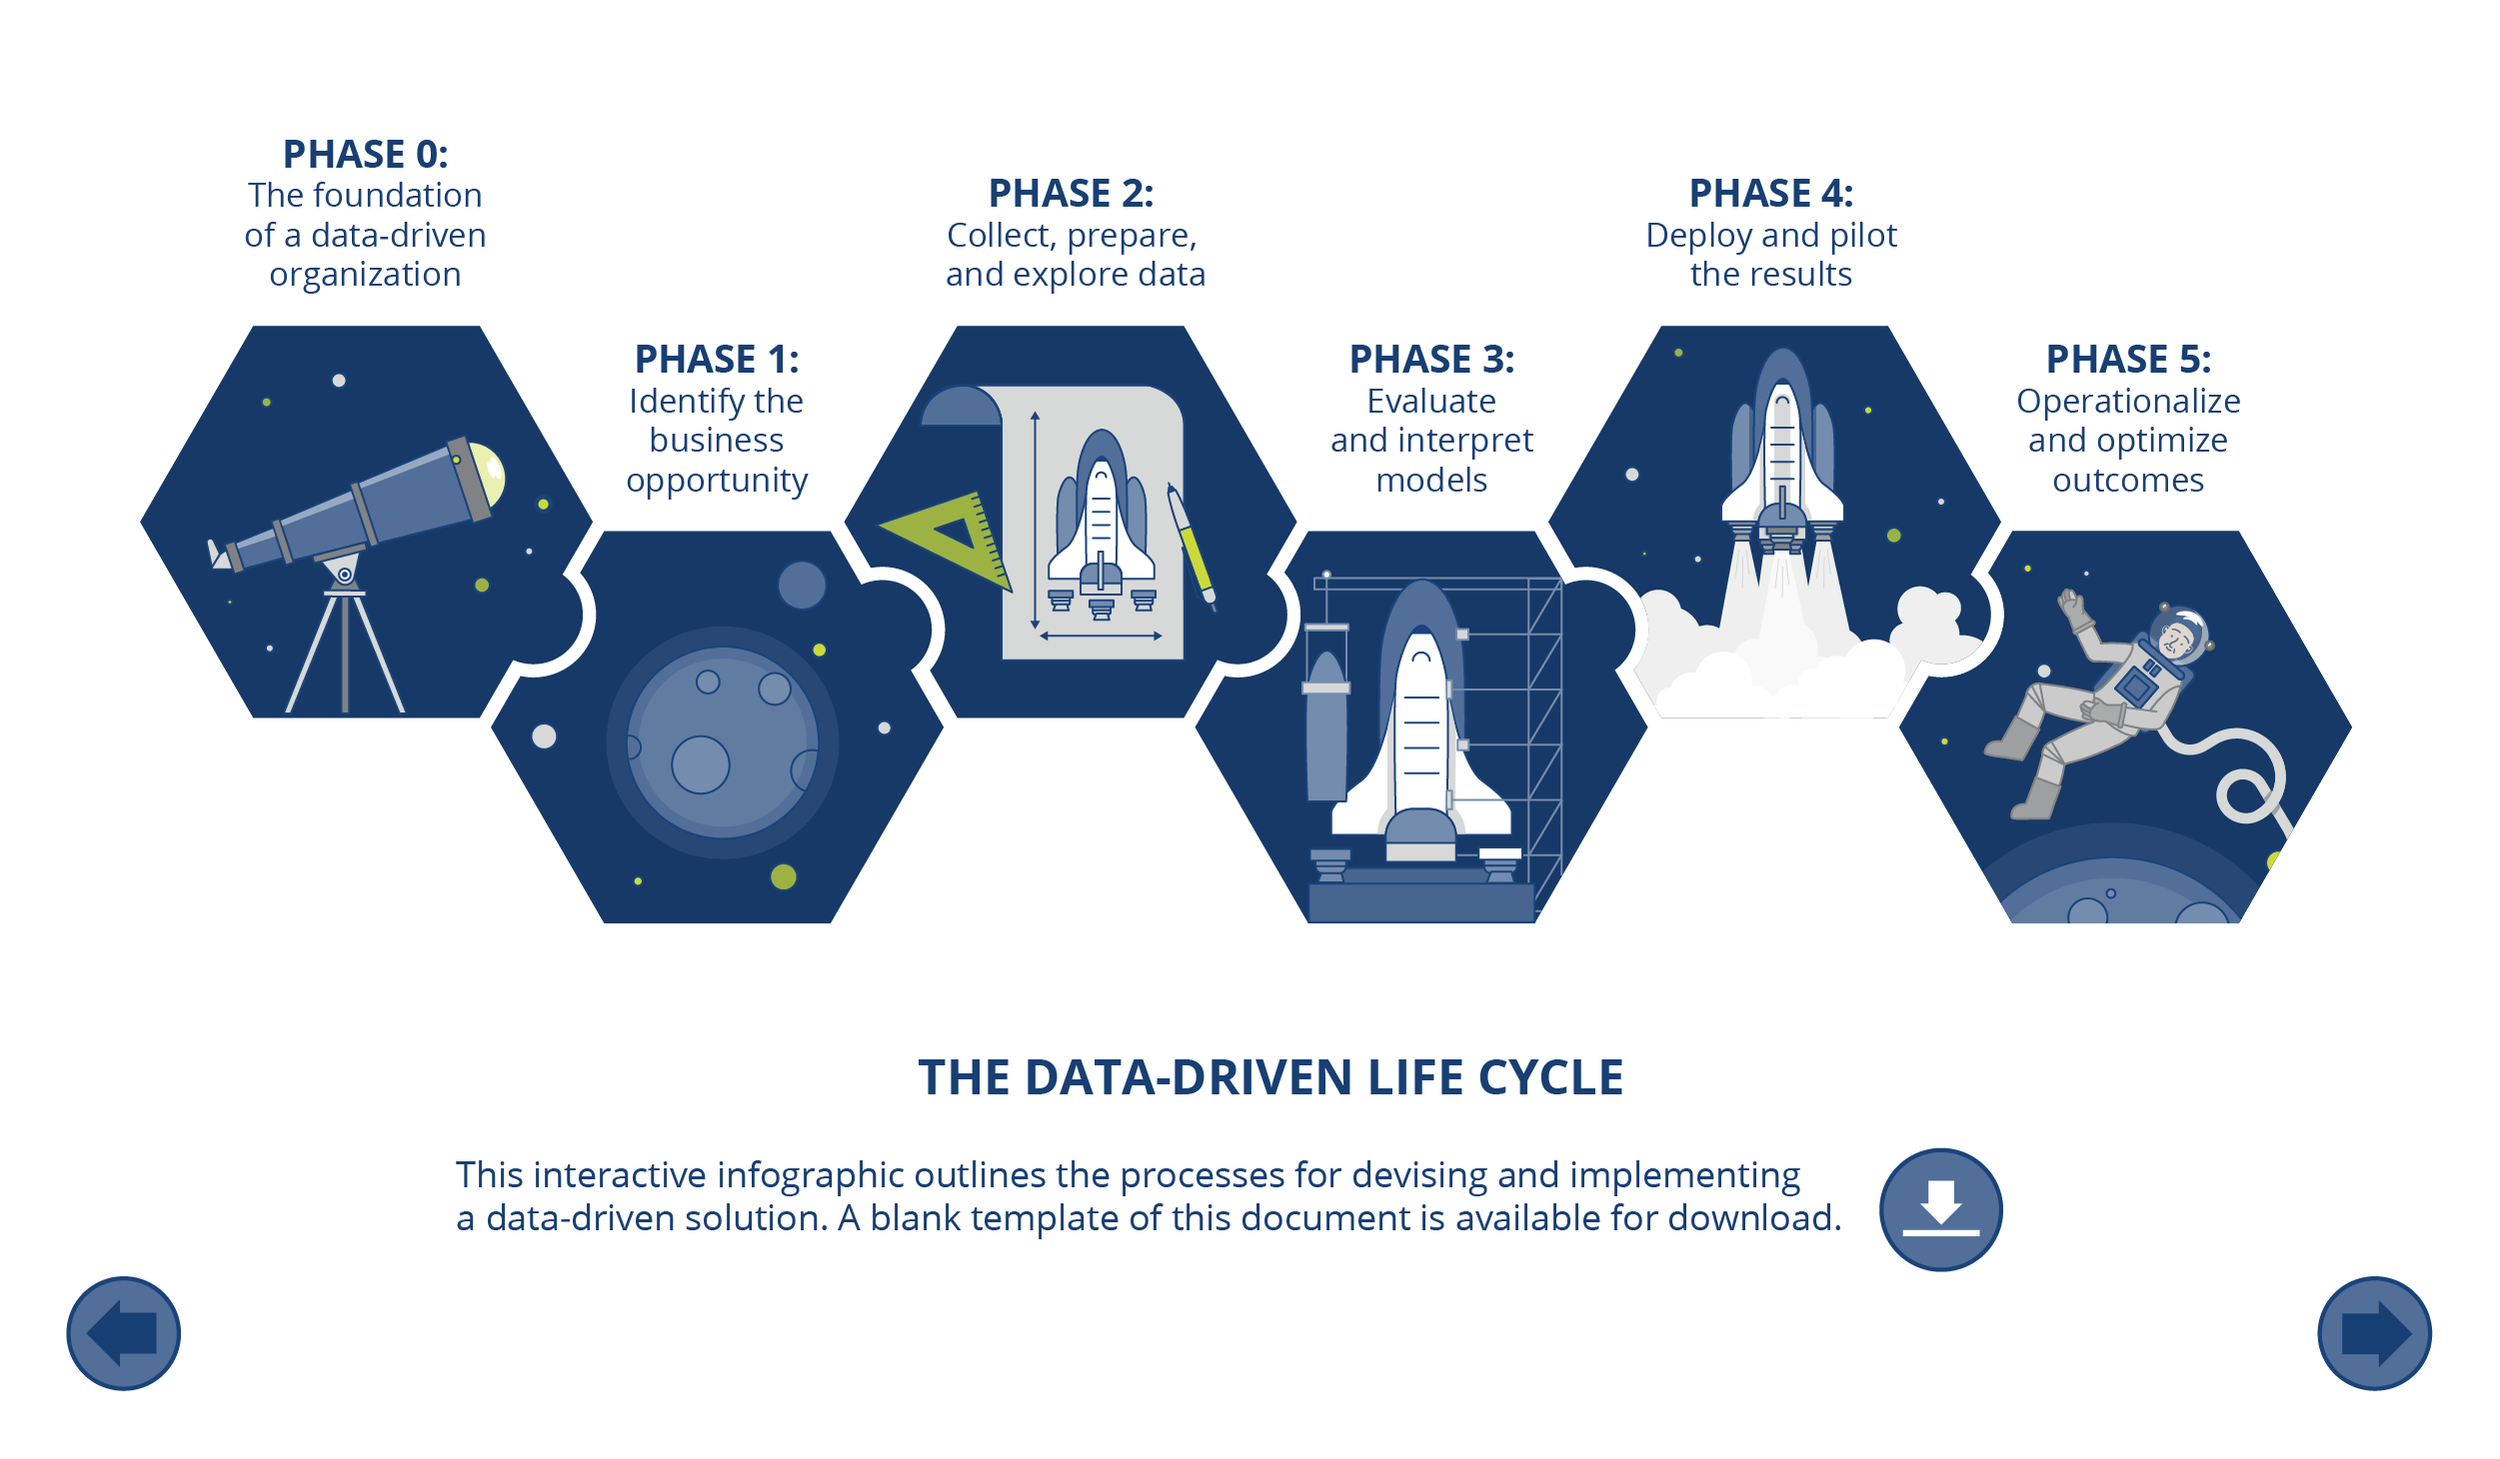
4. Interactive Infographics
Interactive infographics take data storytelling a step further by allowing users to engage with the content actively. Through motion, toggles, filters, and hover effects, they reveal layers of information in a dynamic, user-driven format.
The process begins with defining the core message and identifying which parts of the data or narrative benefit from interaction. We then map out user journeys and interaction points in a wireframe or storyboard format, ensuring that every click, tap, or scroll adds meaning and clarity.
Design and illustration are built with responsiveness and modularity in mind, allowing each component to animate or shift based on user input. The result is an immersive visual experience that turns passive viewing into active exploration — ideal for communicating complex stories in a clear, engaging, and memorable way.